
Relationships and graphs
Mathematical functions describe the relationships such as those between pressure and volume or current and voltage. In some cases, the relationship is linear, in others not. All relationship can be described in the form of an equation, where f() represents some mathematical function.
y = f (x)
When plotting a graph, the independent variable (the one which is under experimental control) is assigned to the x-axis, The dependent variable (the value which is being observed or investigated) is assigned to the y-axis. The scales need not include zero and are not necessarily linear - the graph is just an expedient way of picturing a relationship.
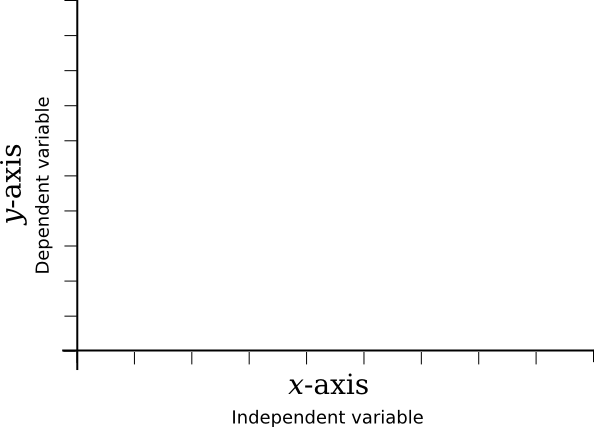
Graph conventions
Linear functions
Linear relationships describe conditions in which the dependent variable changes in proportion with the independent, for example the current through a resistor as the voltage is varied. These equations can be described in the general form of equation 2. Here m represents the gradient of the graph (the rate at which the value of y varies with x ), and c the value of y when x is zero (the y-intercept). The larger the gradient, the faster y increases with any increase in x. The larger the value of c, the greater the value of y when x equals zero (the y-intercept).
y = mx + c General form of a linear equation
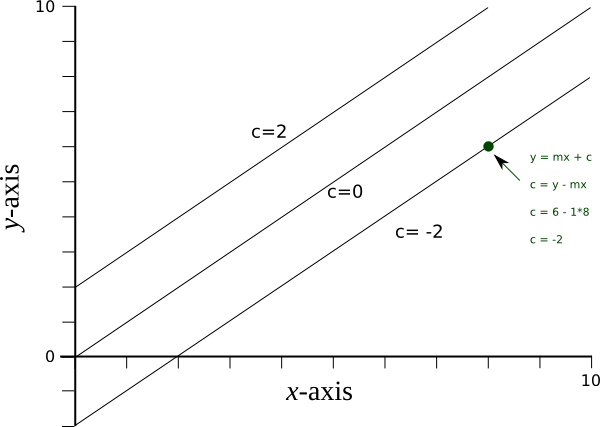
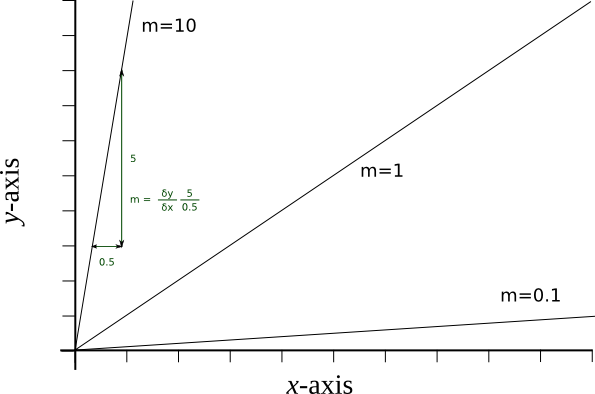
Graphical appearances with differing gradients (m) and constants (c)
Hyperbolic functions
This decribes functions such as equation 3 in which y decreases as x increases (eg. volume with pressure). The magnitude of the relationship is non-linear. When x is small, the are disportionately large changes in the values of y, whereas when x is large, the changes in the value of y are relatively small. Alternatvely, as x increases, y tends towards zero and as x becomes very small, y tends towards ∞.
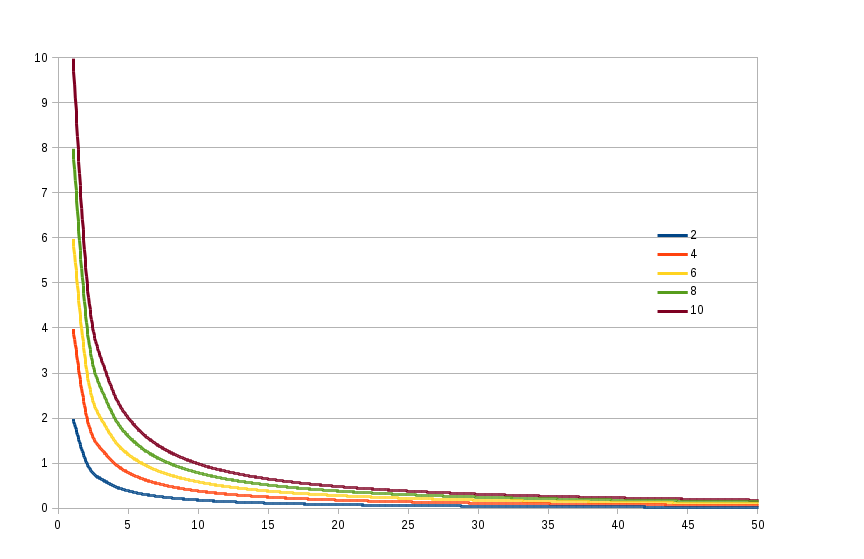
Hyperbolic functions - a family of curves with n = 2 to 10
Powers and bases
Early number systems, such as used by the Romans, exploit symbols which represent specific numbers (I=1, V=5, X=10, L=50 etc. ). These are then combined using a system of addition and subtraction, in order to represent all other numbers ( 12 = XII, 19 = IX ). A far more flexible approach was developed by the Arabic mathematicians in which the position of a digit determines its meaning. This system can be generalised for any number base, as show below.
| Base | b4 | b3 | b2 | b1 | b0 | b-1 | b-2 | Value [Decimal] |
|---|---|---|---|---|---|---|---|---|
| 2 (Binary) | 1 | 0 | 0 | 1 | 0 | 1 | 0 | 10010.1 [18.5] |
| 10 (Decimal) | 0 | 1 | 4 | 2 | 6 | 0 | 8 | 01426.08 [1426.08] |
| 16 (Hexadecimal) | 0 | 0 | 0 | 1 | A | 0 | 0 | 0001A [26] |
The value of any digit n in a number, represents n ∗ baseposition, where postions left of the decimal point have positive values, and those to the right, negative. Hence the hexadecimal number 0001A (we have to ’invent’ 5 new digits to represent values 10(A), 11(B) ... 15(F) in this number system) represents (0 ∗ 164) + (0 ∗ 163) + (0 ∗ 162) + (1 ∗ 161) + (A ∗ 160) or 0 + 0 + 0 + 16 + 10 = 26 (rember, any number raised to the power of zero, is 1).
Logarithms
A different way of representing numbers is involves expressing them as a power of the number base. This is represented as logbase . Using base 10, log10 100 = 2 and log10 1000 = 3. With the use of fractional exponents, any rational number can be represented, for example log101923.45 = 3.284 (103.284).
Two number bases are in common use, base 10 and base e, which has an approximate value of 2.718.
Logarithms to base e are often referred to a natural logarithms and represented by ln, rather than loge.
Traditionally, logarithms have been used as a means of simplifying difficult calculations. Before calculators, large multiplactions and divisions were time consuming and error prone. Logarithms help, because they have useful properties as show in Box 1. Tables of logarithms were published in books. For more informatione see (rapid-tables and chilimath
Exponential functions
Exponential functions take the form bn, where 'b' is the base and 'n' is termed the exponent. Just like logs, these functions have their own rules (more at chilimath.